https://www.bilibili.com/video/BV1GJ41137UH?p=7
图形界面_GUI_程式设计
一、Graphical user interface(图形用户界面)
(一)UI(User Interface)
1、User interface is a method of interaction between a person and a computer(用户界面是人与计算机之间的一种交互方法)
(二)Starting A GUI Program
1、Set your “current folder” where you want to store the GUI program(设置要在其中存储GUI程序的“当前文件夹”)
2、Type guide (graphical user interface design environment)in the command window to create a MATLAB GUI interactively(在命令窗口中键入guide(图形用户界面设计环境)以交互方式创建MATLAB GUI)
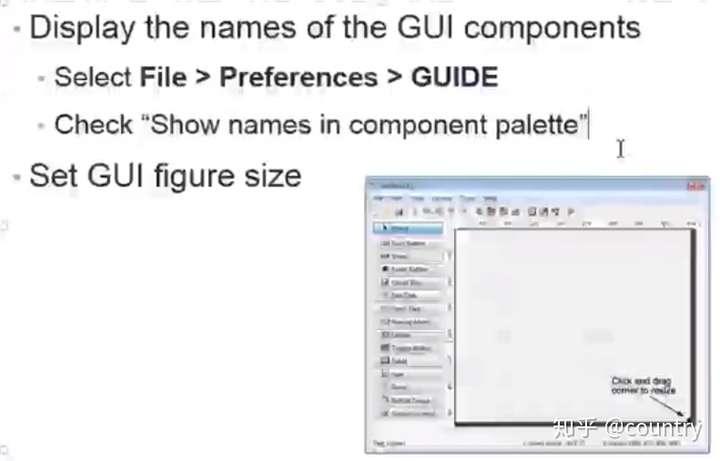
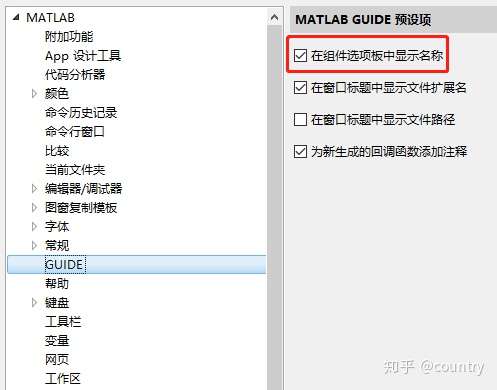
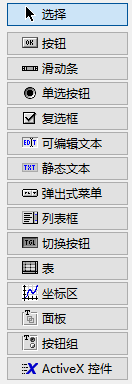
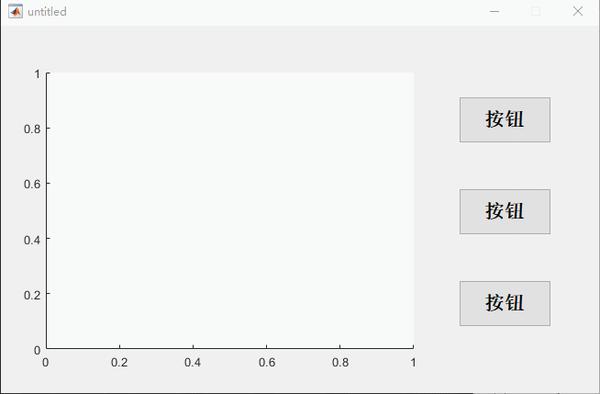
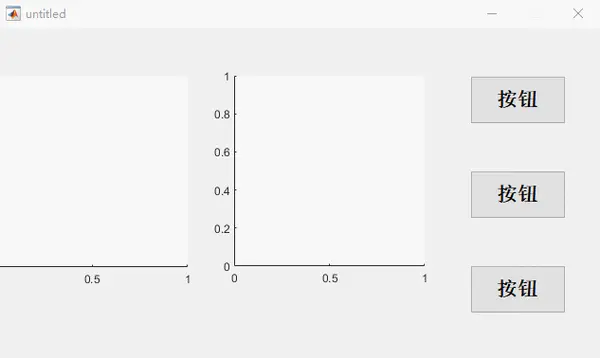
(三)GUI Figure
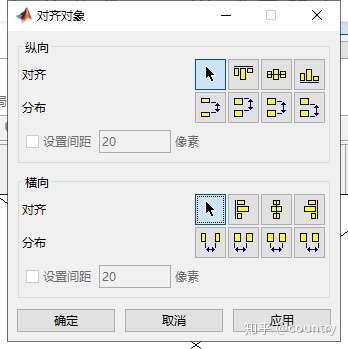
(四)Align the Components(对齐组件)
Tools--Align Objects
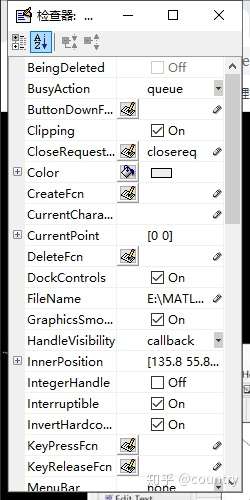
(五)Label the Push Buttons(标记按钮)
View--Property Inspector,或者双击对象
(六)GUI Scrip Structure(脚本结构)
function varargout = untitled(varargin)
% UNTITLED MATLAB code for untitled.fig
...
% Begin initialization code - DO NOT EDIT
...
% --- Executes just before untitled is made visible.
function untitled_OpeningFcn(hObject, eventdata, handles, varargin)
...

%放入程式码的位置(1)

% --- Outputs from this function are returned to the command line.
function varargout = untitled_OutputFcn(hObject, eventdata, handles)
...
% --- Executes on button press in pushbutton1.
function pushbutton1_Callback(hObject, eventdata, handles)

%放入程式码的位置(2)

...
% --- Executes on button press in pushbutton2.
function pushbutton2_Callback(hObject, eventdata, handles)
...
% --- Executes on button press in pushbutton3.
function pushbutton3_Callback(hObject, eventdata, handles)
1、示例代码:(在上部分代码的粗体且斜体(1)的地方,即openingFcn之后)
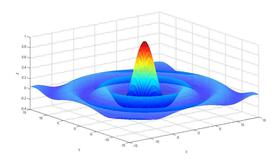
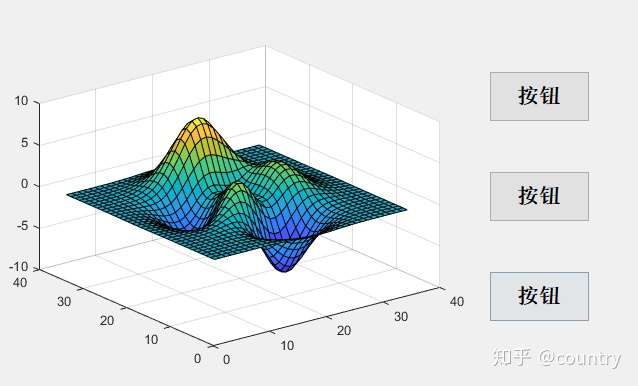
handles.peaks = peaks(35);%handles为openingFcn的内参,cell型
handles.membrane = membrane;
%membrane是一个函数直接输入就会出三维图像,一般和mesh、surf一起用来绘制图像
[x,y] = meshgrid(-8:.5:8);
r = sqrt(x .^ 2 + y .^ 2) + eps;
sinc = sin(r) ./ r;
handles.sinc = sinc;
handles.current_data = handles.peaks;
surf(handles.current_data)
输出结果:
注意:
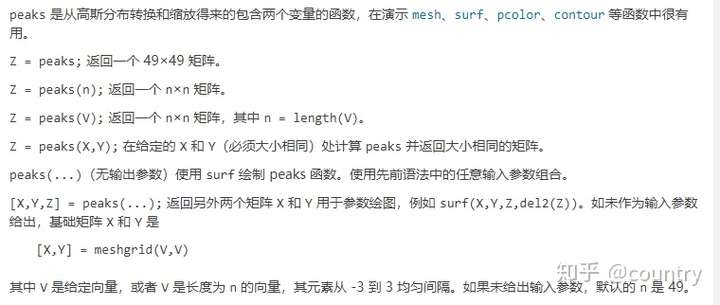
(1)peaks是从高斯分布转换和缩放得来的包含两个变量的函数,在演示mesh、surf、pcolor、contour等函数中很有用。
(2)membrane是一个函数直接输入就会出三维图像,一权般和mesh、surf一起用来绘制图像
(3)[x,y]=meshgrid(-8:.5:8);生成二维或三维网格
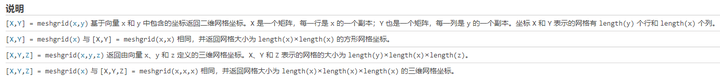
(4)eps是一个函数,它表示的是一个数可以分辨的最小精度。默认时它表示1到它下一个浮点数之间的距离的一半,而正好等于最大小于1的浮点数到最小大于1的浮点数之间的距离。eps=2.2204e-16
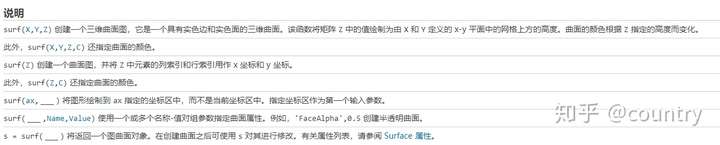
(5)surf()绘制曲面图
2、示例代码:(在上部分代码的粗体且斜体(2)的地方,即pushbutton1_Callback之后)
示例代码:
handles.peaks = peaks(35);
handles.membrane = membrane;
%membrane是一个函数直接输入就会出三维图像,一般和mesh、surf一起用来绘制图像
[x,y] = meshgrid(-8:.5:8);
r = sqrt(x .^ 2 + y .^ 2) + eps;
sinc = sin(r) ./ r;
handles.sinc = sinc;
handles.current_data = handles.peaks;
surf(handles.current_data)
输出结果:
3、What If We Have Two axes?(如果有两个axes,会咋样呢)
---会显示在第二个,即最后一个axes上
(七)handles - Parents of the GUI Object(GUI对象的父对象)
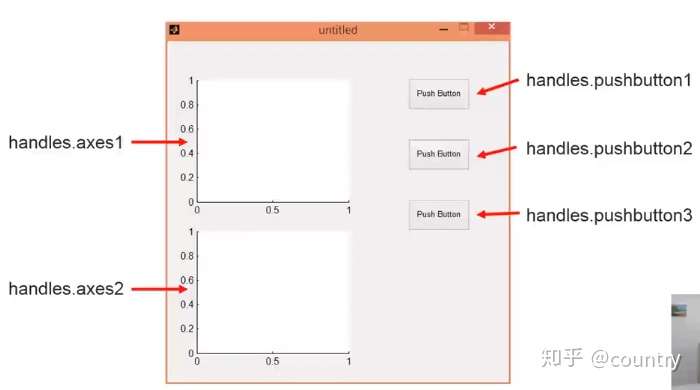
1、Setting the axes for Plotting(设定绘制的轴ID)
示例代码:
%将上面的代码中
surf(handles.current_data)
%改为
%(1)
axes(handles.axes1);%呼叫axes1,后面所作的操作都是在axes上操作
surf(handles.current_data);
%或者
%(2)
surf(handles.axes1,handles.current_data);%surf的操作在axes1上进行
输出结果:
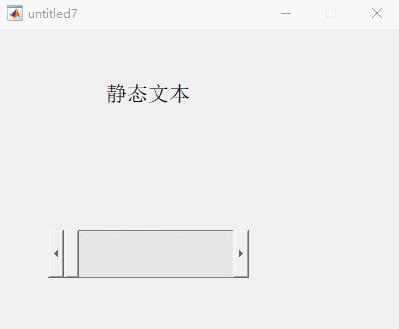
(八)Review - set() and get()
1、get() acquires properties:获取特性
2、set() sets properties:设置特性
示例代码:
a = get(handles.slider1,'Value');
set(handles.text2,'String',num2str(a));
输出结果:
注意:
·添加位置在 slider1_Callback 中
(九)Practice
1、Write a GUI program
2、It contains 2 sliders each of which is associated with a variable with value ranged from 0 to 100
3、Display the summation of the slider variables as an integer
4、You may need these function:get()、set()、 int16()、num2str()
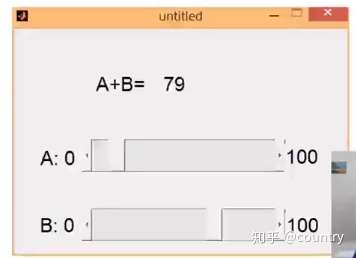
答案代码:
a = int16(get(handles.slider1,'Value'));
b = int16(get(handles.slider2,'Value'));
c = (a + b);
set(handles.text5,'String',num2str(c));
set(handles.text9,'String',num2str(a));
set(handles.text11,'String',num2str(b));
输出结果:
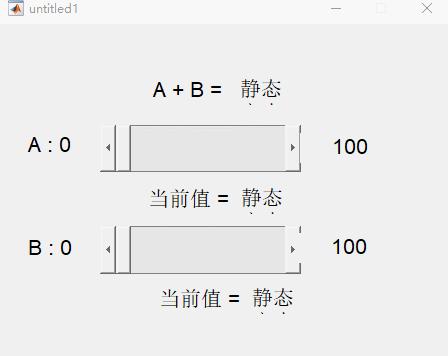
注意:
在 slider1_Callback 和 slider2_Callback 中都要加入上述程序
(十)Using handles to Store Variables
1、Variables in callback functions are local variables(回调函数中的变量是局部变量)
2、handles is also used to pass variables from one GUI object to another(handles也用于将变量从一个GUI对象传递到另一个GUI对象)
3、Store variable a into handles
示例代码:(guidata()固定配合,不可变更)
handles.myData = a;
guidata(hObject,handles);
4、Retrieve variable a from handles
示例代码:
a = handles.myData;
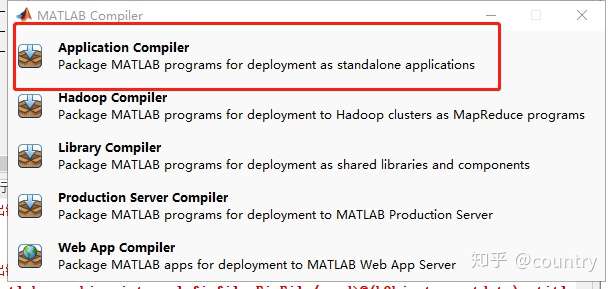
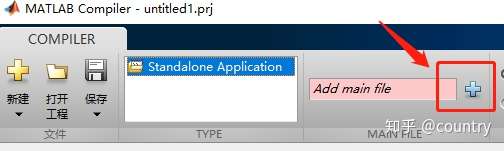
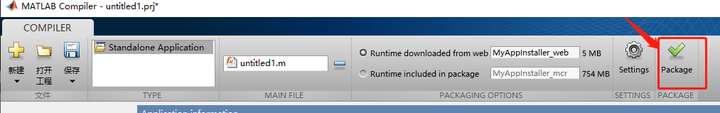
(十一)Compiling the GUI Program(编译GUI程序)
deploytool
=====================================
======================================
1, GUIDE
网上很多简化教程都是基于GUIDE模式的,这样的构建挺好的。
但是,这不利于搭建自有工具包和编译exe,所以选用命令流。
如果对于GUIDE模式感兴趣
doc GUIDE
2,Model,View,Control
% 预清除
clc
clear
clf
View界面
就是写出来要用户看到的界面。
比较特殊的是按钮。按钮除了能显示出来被看到外,还有一个回馈机制,叫做Callbacks。点击就会运行它调用设置好的函数,此文为更新函数(Update)。
建议使用断点模式,一行一行运行理解。如果对这个层不熟悉了,请去看此专栏(003)
%建议使用断点模式,一行一行运行理解。
% 第一层 figure,如果对这个层不熟悉了请去看此专栏(003)
fig = figure(1);            % 声明一家之主

% 第二层 #1 axes             % 大儿子能划线,画面,画体,反正就是画画画
ax.Parent = fig;
ax.Units = 'normalized';
ax.Position = [0.15,0.3,0.5,0.6];
ax.Box = 'on';
ax.Title.String = '拟合工具';
ax = axes(ax);

% 第二层 #2 预制 文字        % 二儿子能 显示,复制字符
txtFit.Parent = fig;
txtFit.Style = 'edit';
txtFit.Units = 'normalized';
txtFit.Position = [0.7,0.4,0.25,0.4];
txtFit.String = '点击拟合,开始运行';
txtFit.Enable = 'off';    % 关闭提示信息编辑
txtFit.Max = 3;
txtFit = uicontrol(txtFit);

% 第三层 #3 预制 按钮        % 三儿子就是个按钮
btn.Parent = fig;
btn.Style = 'pushbutton';
btn.Units = 'normalized';
btn.Position = [0.4,0.05,0.2,0.1];
btn.String = '拟合';
btn.TooltipString = '点击拟合';
btn.Callback = {@Update,ax,txtFit}; % V通知到C
btn = uicontrol(btn);% 代码运行到这里可以先看下界面了;但是点击按钮会报错,因为没有写那个要用的更新函数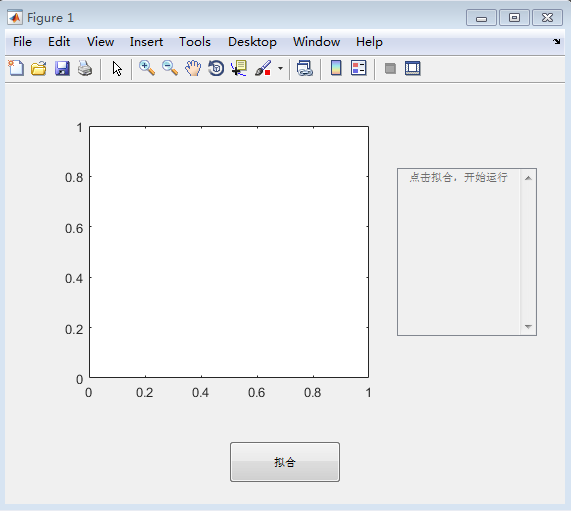
Control 控制
当接收到View的通知(点击按钮),控制就会运行其它函数,并控制View更新显示。
function ax = Update(obj,event,ax,txtFit) % obj,event这是默认出现的参量,是调用按钮所附加的。
[dataX,dataY] = ReadXlsxData;
[fr,gof] = FitData(dataX,dataY);
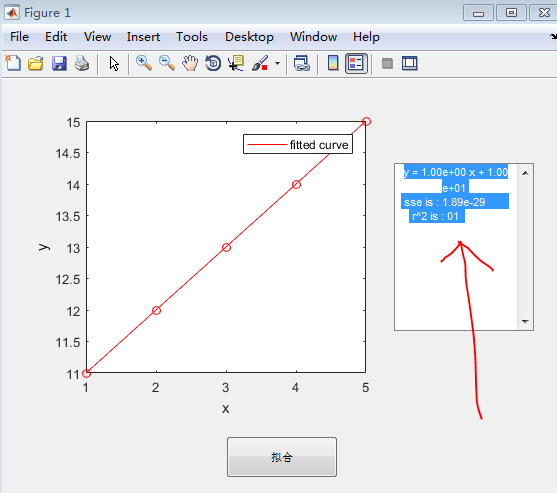
plot(ax,dataX,dataY,'ro');
hold on
plot(fr)
hold off
str = sprintf('y = %0.2d x + %0.2d \n sse is : %0.2d \n r^2 is : %0.2d',fr.p1,fr.p2,gof.sse,gof.rsquare);
txtFit.String = str;
txtFit.Enable = 'on'; %新的内容会覆盖掉旧的内容,可反复拟合不同.xlsx里的数据
endModel模型
核心内容的就一个函数拟合,因为只有它做最核心的计算出拟合系数的活。
function [fr,gof] = FitData(dataX,dataY)
ft = fittype('poly1');
[fr,gof] = fit(dataX,dataY,ft);
end
其它辅助函数
% 载入数据 把数据按图写入excel表格,并保存为.xlsx的文档。
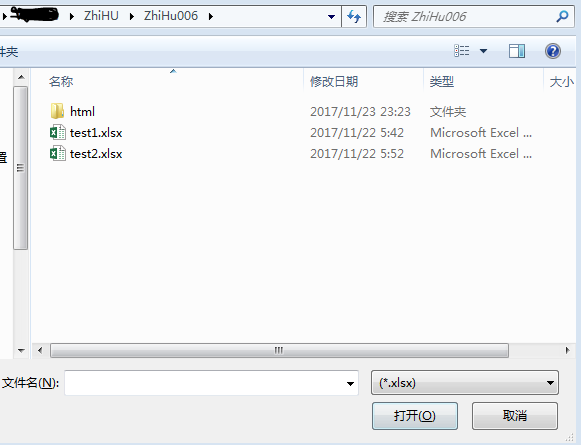
function [dataX,dataY] = ReadXlsxData
fileName = uigetfile('*.xlsx');
tempData = importdata(fileName);
dataX = tempData.data(:,1);
dataY = tempData.data(:,2);
end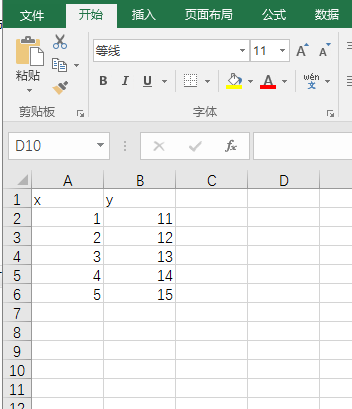
把Part3下面所有代码贴到一个.m文件(2017a支持在一个文件,如果2014b以后有不支持的,额外贴两个function就是了),自己准备两三个不同数据.xlsx,运行一下APP的快感吧。再次点击拟合是会让你选新的数据组的呦。
App明白过程就好,先试试修修改改这个流程,然后再改进升级吧。

